Graphs panel is used for comparative analysis of the history of sensor readings; Multiple sensor readings can be added to the graph

Add new elements to the graph
Steps | ||
|---|---|---|
1 |  | Press the gear icon located at the right side of top panel to open a modal . |
2 | 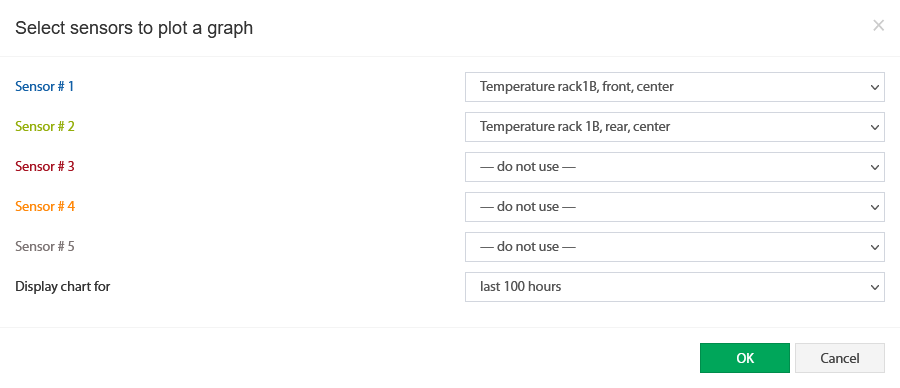 | Select sensor values to be displayed on the graph and press Ok |
3 | Choose time period to display the chart for. |
Press