The system allows you to customize the dashboard individually for each user. And display the most important information on it in a visual form. The view of the dashboard element depends on the data it represents.

Analog sensors
Analog sensors can be represented as a chart or as a gauge meter. When outputting data from 2 or more sensors, only a chart view is possible.

If there is only one sensor, then the view can be switched.
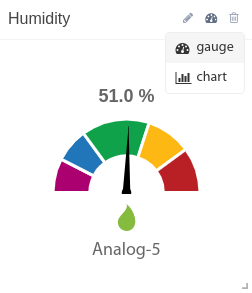

If you are only interested in the narrow range of the sensor values, you can limit the output to this range by setting the Minimum value and Maximum value.

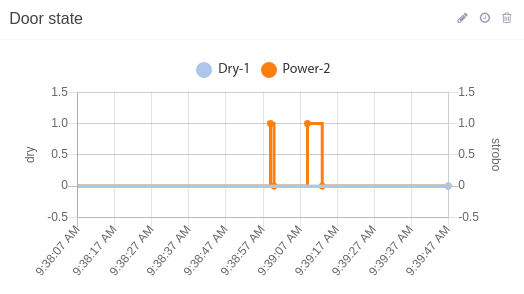
Discrete sensors and elements
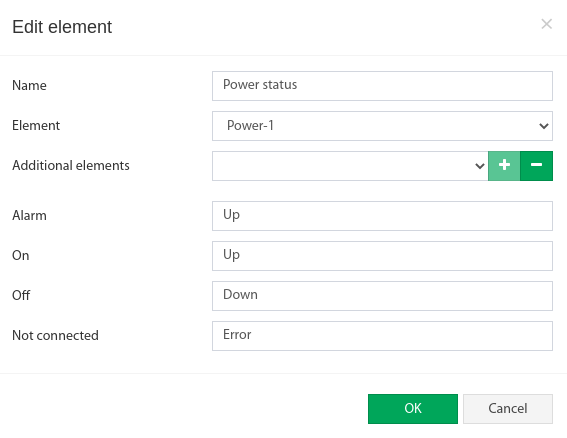
Dry contact inputs, as well as switches, relays, pings, timers, and other elements that take discrete values can be displayed as a chart or as a state. When configuring state view, you can set aliases for the element states that will be displayed on the dashboard.


When outputting data from 2 or more sensors, only a chart view is possible.