...
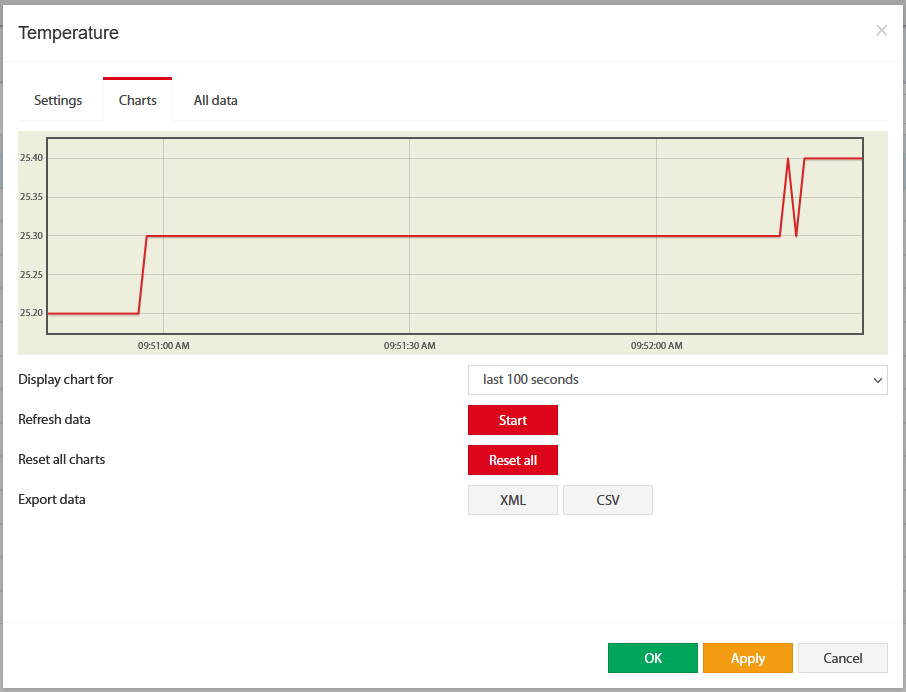
Charts tab
The charts tab shows the following:
| Display chart for |
| |
| Refresh data | Start | Poll a sensor |
| Reset all charts | Reset all | Clears all saved data for the sensor. |
| Export data | XML or CSV | Exporting data through WebUI does not work for more than a couple of days and is very rough. If you need detailed log data, use the logging of sensor values to the media: Read more at: System Log, Sensors dump files |
Example: Using fuel tanks.
Each fuel tank has its own formula for volume vs height. Please see this useful resource for finding out such a formula.
...