This article is also available in the following languages: 
| Child pages (Children Display) |
|---|
Infrastructure monitoring programmprogram is preloaded with NMS Nagios plugins check for master modules and is provided as a virtual machine image in an open format ova
The virtual machine image with the operating system CentOS 6.5 system and Nagios 3.5.1 is available:
Nagios 3.5.1 with control via a web interface (NagiosQL) CentOS-6.5-i386-nagios3_091.ova |
|---|
To deploy the system used the program VirtualBox https://www.virtualbox.org/ version 4.3.8 r92456
The composition of a virtual machine image
Nagios to empower the system also installed the following packages:
- Net-SNMP - provides working with SNMP PDU http://www.net-snmp.org/;
- pnp4nagios - graph display for monitoring data http://docs.pnp4nagios.org ;
- SNMPTT - data translator SNMP Trap PDU http://snmptt.sourceforge.net/ ;
- NagiosQL - web interface for managing configuration files Nagios http://www.nagiosql.org/;
- Postfix - management system for e-mail messages http://www.postfix.org/
- check_vutlan.pl - plugin for sensor control by SNMP from VUTLAN 71273000 ;
- check_vutlan_table.pl - plugin to table of sensors control for master module Vutlan по SNMP 71273000 ;
- submit_check_result - passive checking script for receive SNMP Trap PDU 71273000 ;
Nagios resources allocating at file system:
- settings: /etc/nagios (defined by the requirements package NagiosQL.);
- resources: (web interface etc): /usr/share/nagios
- plugins: /usr/lib/nagios/plugins
Procedure to start a virtual machine image
- To start a virtual machine under Windows, you must download and install it: http://download.virtualbox.org/virtualbox/4.3.10/VirtualBox-4.3.10-93012-Win.exe
- After installing the distribution must import a virtual machineova в VirtualBox by command File->Import appliance(Ctrl+I)
- Before starting the virtual machine, you must check the network settings: Settings->Network->Adaper1. Connection type Attached to for network adapter: "Bridget adapter" ("Сетевой мост"). The IP address for the virtual machine must be setup set up dynamically.
- Next, run a virtual machine Machine->Start or the corresponding icon.
- After loading CentOS Linux will prompt the console. Accounts to login: user / guest, root / guest Working under the 'root' user is not recommended. System control is also possible via SSH.
- Next, you need to find out the current IP address of the network adapter on the DHCP virtual machine server, either directly through the virtual machine console command:
Code Block language text $ ifconfig eth0
where $ - shell prompt
- The resulting IP address can be used to connect to the web interface of Nagios. To do this, you must enter this address into your browser. If the network is properly configured in the Web browser appears authorization form. Account login for standard Nagios: nagiosadmin / nagiosadmin
Approximate form interface Nagios: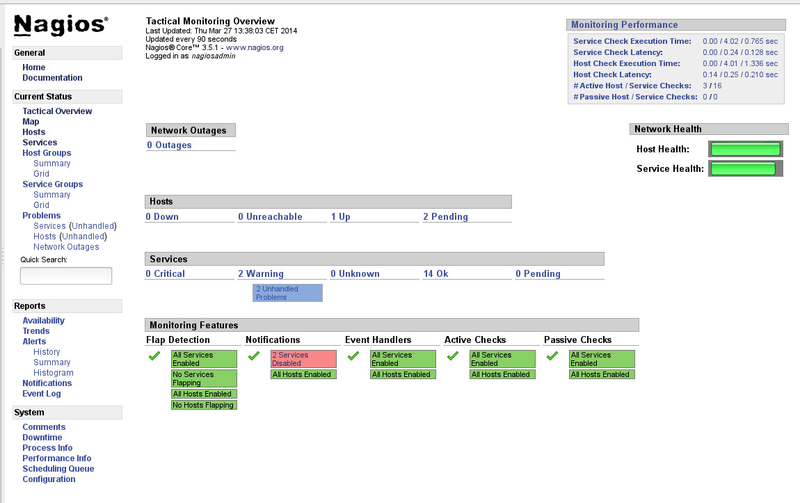
For a normal shutdown of the virtual machine using the following command. The centralized monitoring system will be halted.
Code Block language text $ sudo halt
Manage centralized monitoring system
- To manage configuration files Nagios must switch to administration via the menu item Contibute-> Administation in the left panel web interface Nagios. Current account login is the same as for the web interface Nagios: nagiosadmin / nagiosadmin
- Management hosts available through Supervision-> Host:
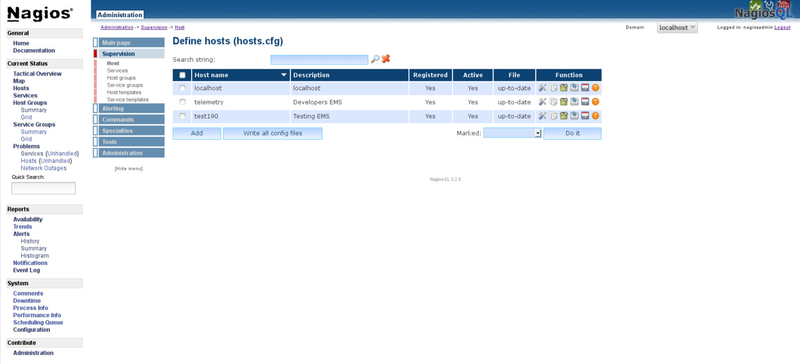 When you add a host record for the VUTLAN master modules, it can be placed in a group of hosts sc-hosts. The group sc-hosts are already bound services:
1) PING - check service availability of the host;
2) UPTIME - time service in the ON state;
3) VUTLAN Table of Elements Service - service to check the table of elements master module;
4) Trap1 - processing service ladder named Trap1;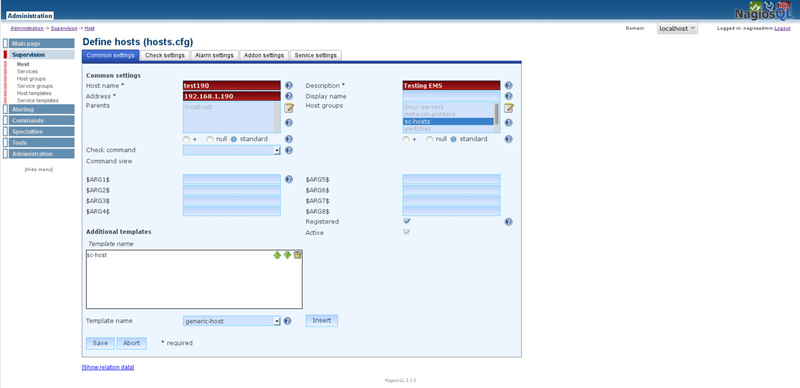
- Management services available through Supervision-> Services
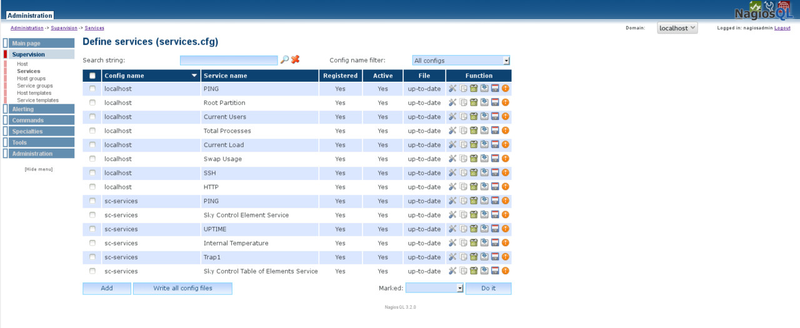
Service settings and connection to the host (host group) performed in service properties. The figure shows the connection of the validator element to the host test190 (list of hosts) through the ID of the element (-i 1002) with the community SNMP (-C read) (sm.pole $ ARG1 $)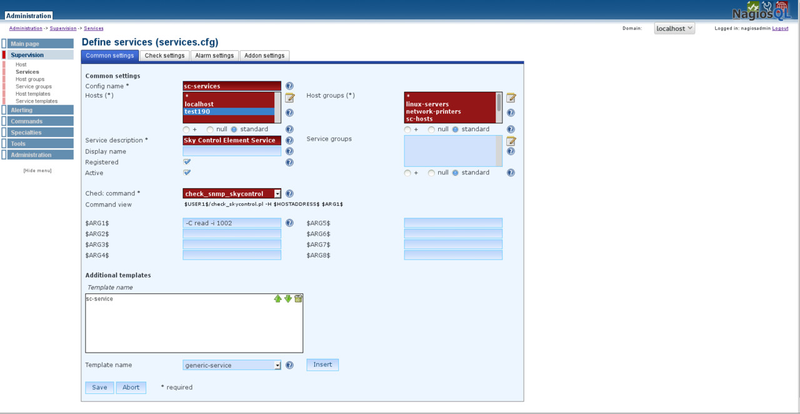
- Manage Alerts available through Alerting
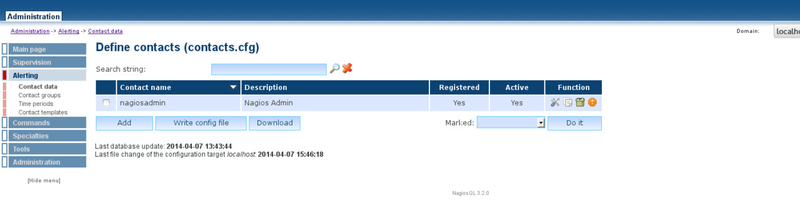
Add / Edit the current range are is available through contact Alerting-> Contact data In the E-Mail addressAddress must specify the address of the administrator NMS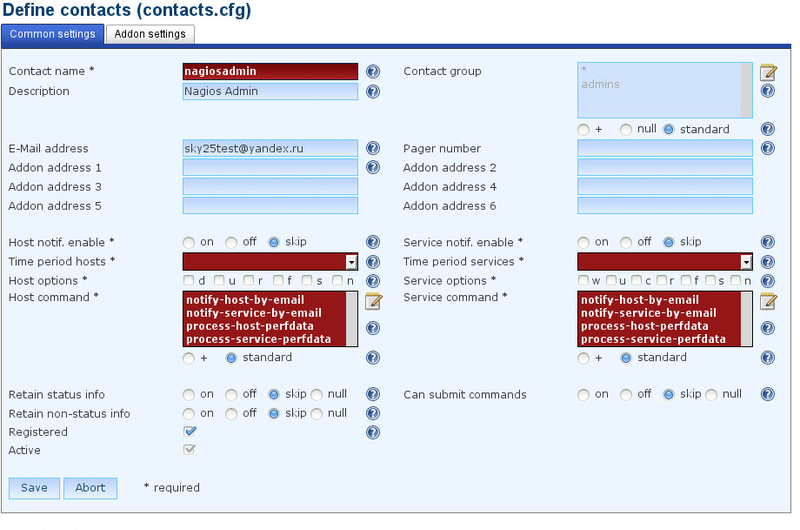
Transmission of notification provided MTA Postfix. Configuring Postfix is beyond the scope of this description. - For notify by internal GSM modem module setup options for notify-host-by-sms and notify-service-by-sms command:
change IP or hostname master-module with GSM modem by option '-H' and change password for this master module by option '-p'
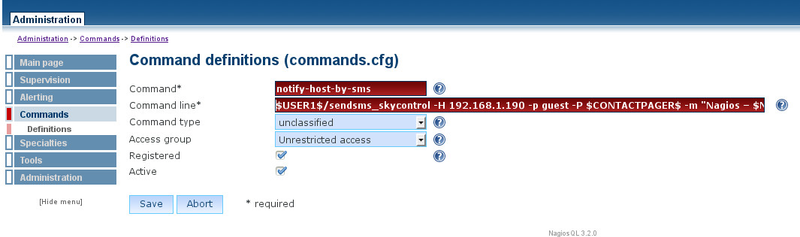
Select pager number by contact editing form as bellow: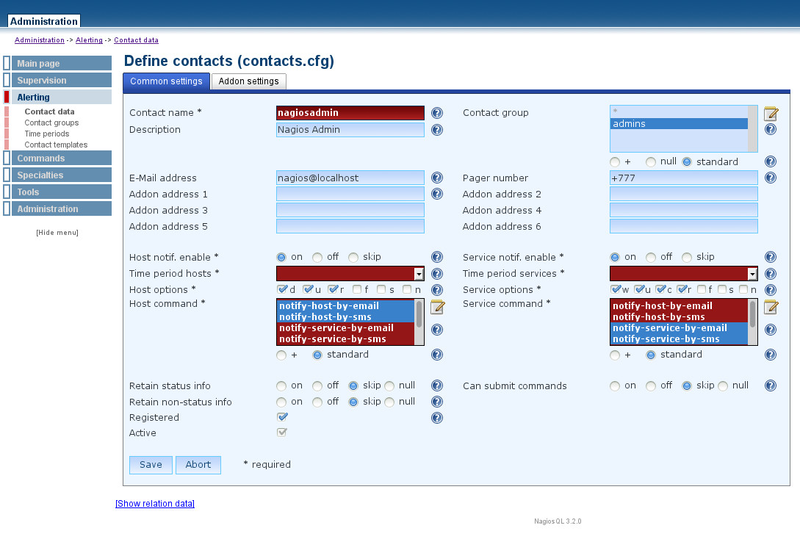
- To apply the current configuration, you must perform its verification Tools->Nagios control->Check configuration files->Do It.
Then restart Nagios service by the command Tools->Nagios control->Restart Nagios->Do It.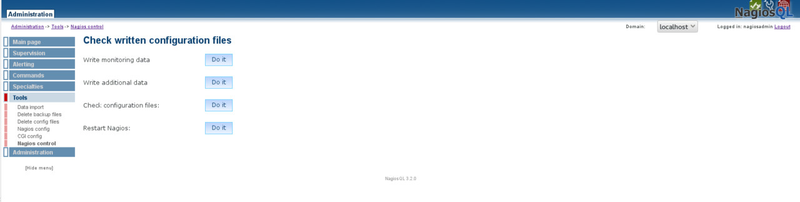
Using the centralized monitoring system
Monitoring data available through the web interface Nagios.
To access the hosts as necessary to use Current Status->Hosts
To access the services you want to use as Current Status->Services
Example state of services on the host is shown in Figure:
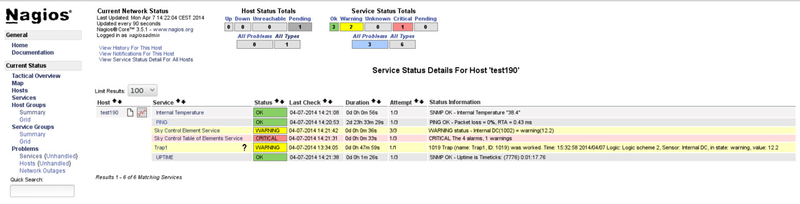
Host column contains the host name and host control buttons via a web interface (the icon of the document) and display performance data as graphs (graph icon)
Service column contains the current state of the host. In Nagios, the following condition:
Service column contains the current state of the host. In Nagios, the following condition:
- PENDING - object has not yet been questioned;
- UNKNOWN - state of the object is not defined;
- OK - object in the normal state;
- WARNING - warning, the object in a state close to the critical;
- CRITICAL - to in a critical state;
Status Information column contains a text description of the service.
Learn more about working with Nagios in the official documentation: http://library.nagios.com/library/products/nagioscore/manuals/